| Heliospheric Weather Expert Service Centre - Statistical Products |
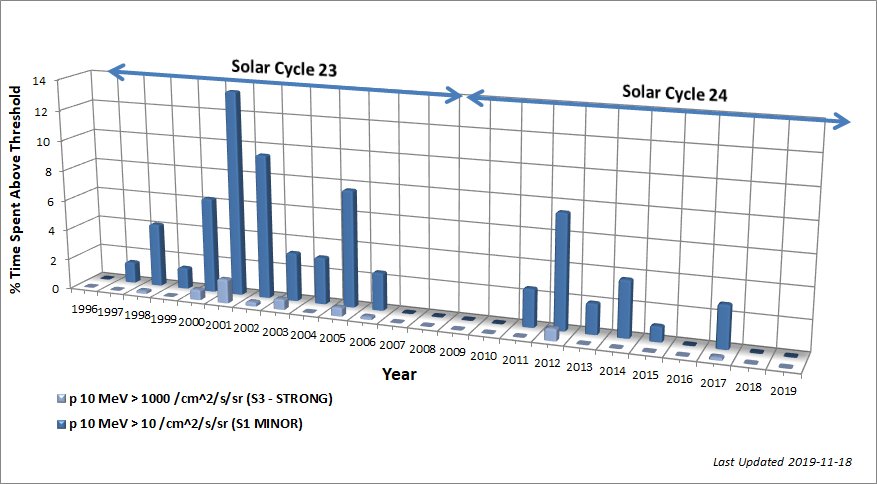
This section provides information on the solar energetic particle environment during yearly intervals. This is represented by the flux of 10 MeV and above proton particles measured at geostationary altitudes by the GOES spacecraft (>30MeV and >60MeV can also additionally be selected from the options for reference). The amount of time spent above one of five activity threshold limits will be calculated. Horizontal red lines are shown on the plot indicating the time intervals listed at the bottom of the page that match the user criteria.
The analysis is based on the OMNI database of upstream solar wind parameters produced by NASA.
The interval and threshold can be selected from the pull down menu. The time interval display cannot be edited directly. The mouse can be used to zoom the time selection (the Y scale is fixed). Pressing submit will recalculate the display for the new interval.
The SEP activity follows the 11 year solar cycle - currently (2020) we are approaching the declining solar minimum of solar cycle 24.
This web page forms part of the European Space Agency's network of space weather services and service development activities, and is supported under ESA contract number 4000134036/21/D/MRP. For further product related information or enquiries contact the helpdesk. E-mail: helpdesk.swe@esa.int All publications and presentations using data obtained from this site should acknowledge RAL Space and The ESA Space Safety Programme. For further information about space weather in the ESA Space Safety Programme see: https://www.esa.int/spaceweather Access the ESA SWE Portal here: https://swe.ssa.esa.int.