| Heliospheric Weather Expert Service Centre - Product Browser |
The Sun continuously emits a solar wind outflow with an average speed of about 400-500 km/s. From coronal holes, which are regions of open magnetic field on the Sun, a higher than average solar wind flow is emanated, having speeds of the order of greater than 500 km/s up to roughly 800 km/s. The solar wind of increased speed, may have space weather effects, and may influence the performance and reliability of space-borne and ground-based technological systems.
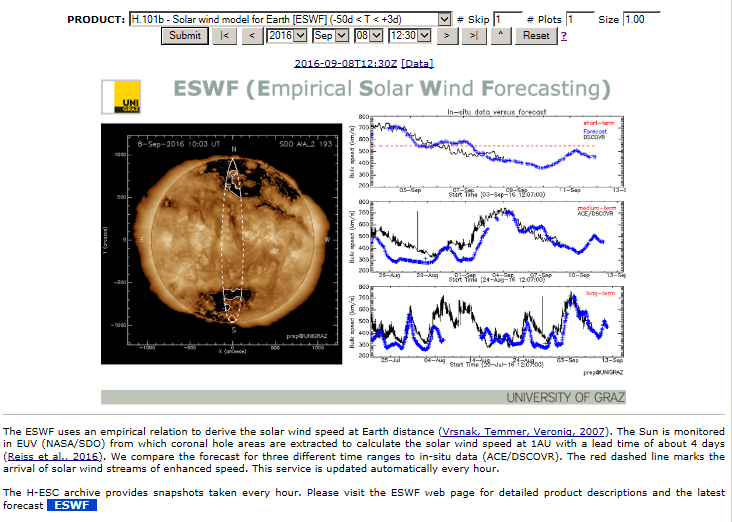
Based on a relation between EUV observations of the area of coronal holes on the Sun and the solar wind speed as measured at 1AU, the empirical solar wind speed forecast model (ESWF) was developed (see Vrsnak, Temmer, and Veronig, 2007; Rotter et al., 2012; Reiss et al., 2016). The service, based on this model, is automatized and provides on an hourly basis solar wind speed forecasts with a lead-time of about 4 days.
The graphical output covers the EUV data (SDO/AIA 193) from which the coronal hole areas are extracted. The extracted areas are visually marked. The Earth-directed areas, the crucial input for calculating the solar wind forecast at 1AU, are identified by white contour lines lying with a slice (white-dashed line) covering an angle of 7.5 degrees from the central meridian of the Sun (latitudinal extent of about +/-90 degrees).
The solar wind speed forecast is overplotted with actual measurements of the solar wind speed. Hence, by inspecting the graphical outputs, the user gains a prompt visual impression of the quality of the forecast. For immediate checking the quality of the forecast we provide three different time-ranges. A long-term output covering almost two entire solar rotations, a medium-term covering two weeks and a short-term over 5-days for more details. The red dashed line marks the arrival of solar wind streams of enhanced speed.
The currently supplied data file (accessed from the link next to the time above each plot) provides approximately the last months worth of data with each new SDO image (approximately every hour) adding and additional record to the end and pruning the first record from the start.
The file is in fixed format ASCII with an initial header record describing each of the columns
| Parameter | Description |
|---|---|
| SDO_YEAR | The four digit year corresponding to the date when the SDO image was taken |
| SDO_DOY | The decimal day of year when the SDO image was taken |
| SDO_DATE | The date of the SDO image represented in ISO8601 calendar date format |
| SDO_RATIO_7.5 | The ratio of coronal hole in the 7.5 degree meridional cut |
| V_YEAR | The four digit year corresponding to the date for which the forecast speed corresponds |
| V_DOY | The decimal day of year when forecast speed correspond |
| V_DATE | The date for the forecast speed represented in ISO8601 calendar date format |
| V (km/s) | The forecast speed |
| B_YEAR | The four digit year corresponding to the date for which the forecast magnetic field corresponds |
| B_DOY | The decimal day of year when forecast magnetic field correspond |
| B_DATE | The date for the forecast magnetic field represented in ISO8601 calendar date format |
| B (nT) | The forecast magnetic field The empirical relation for forecasting B is currently unreliable and these values should not be used] |