| Heliospheric Weather Expert Service Centre - Solar Wind Forecast Speed Comparison |
The H-ESC uses a number of different models to forecast the solar wind speed at Earth. The models use different techniques and may be physics based, use empirical relations or assume persistence of conditions measured by satellites in other solar system locations or from the previous solar rotation. The reason for providing multiple models is that each has its own characteristics and caveats and may work better or worse depending on current space weather conditions. A simplified, low-resolution, overview of the model results is presented here to aid comparison and help assess the range of forecasts over the next few days.
You can return to the main product using the breadcrumb at the bottom of the page or by clicking HERE.
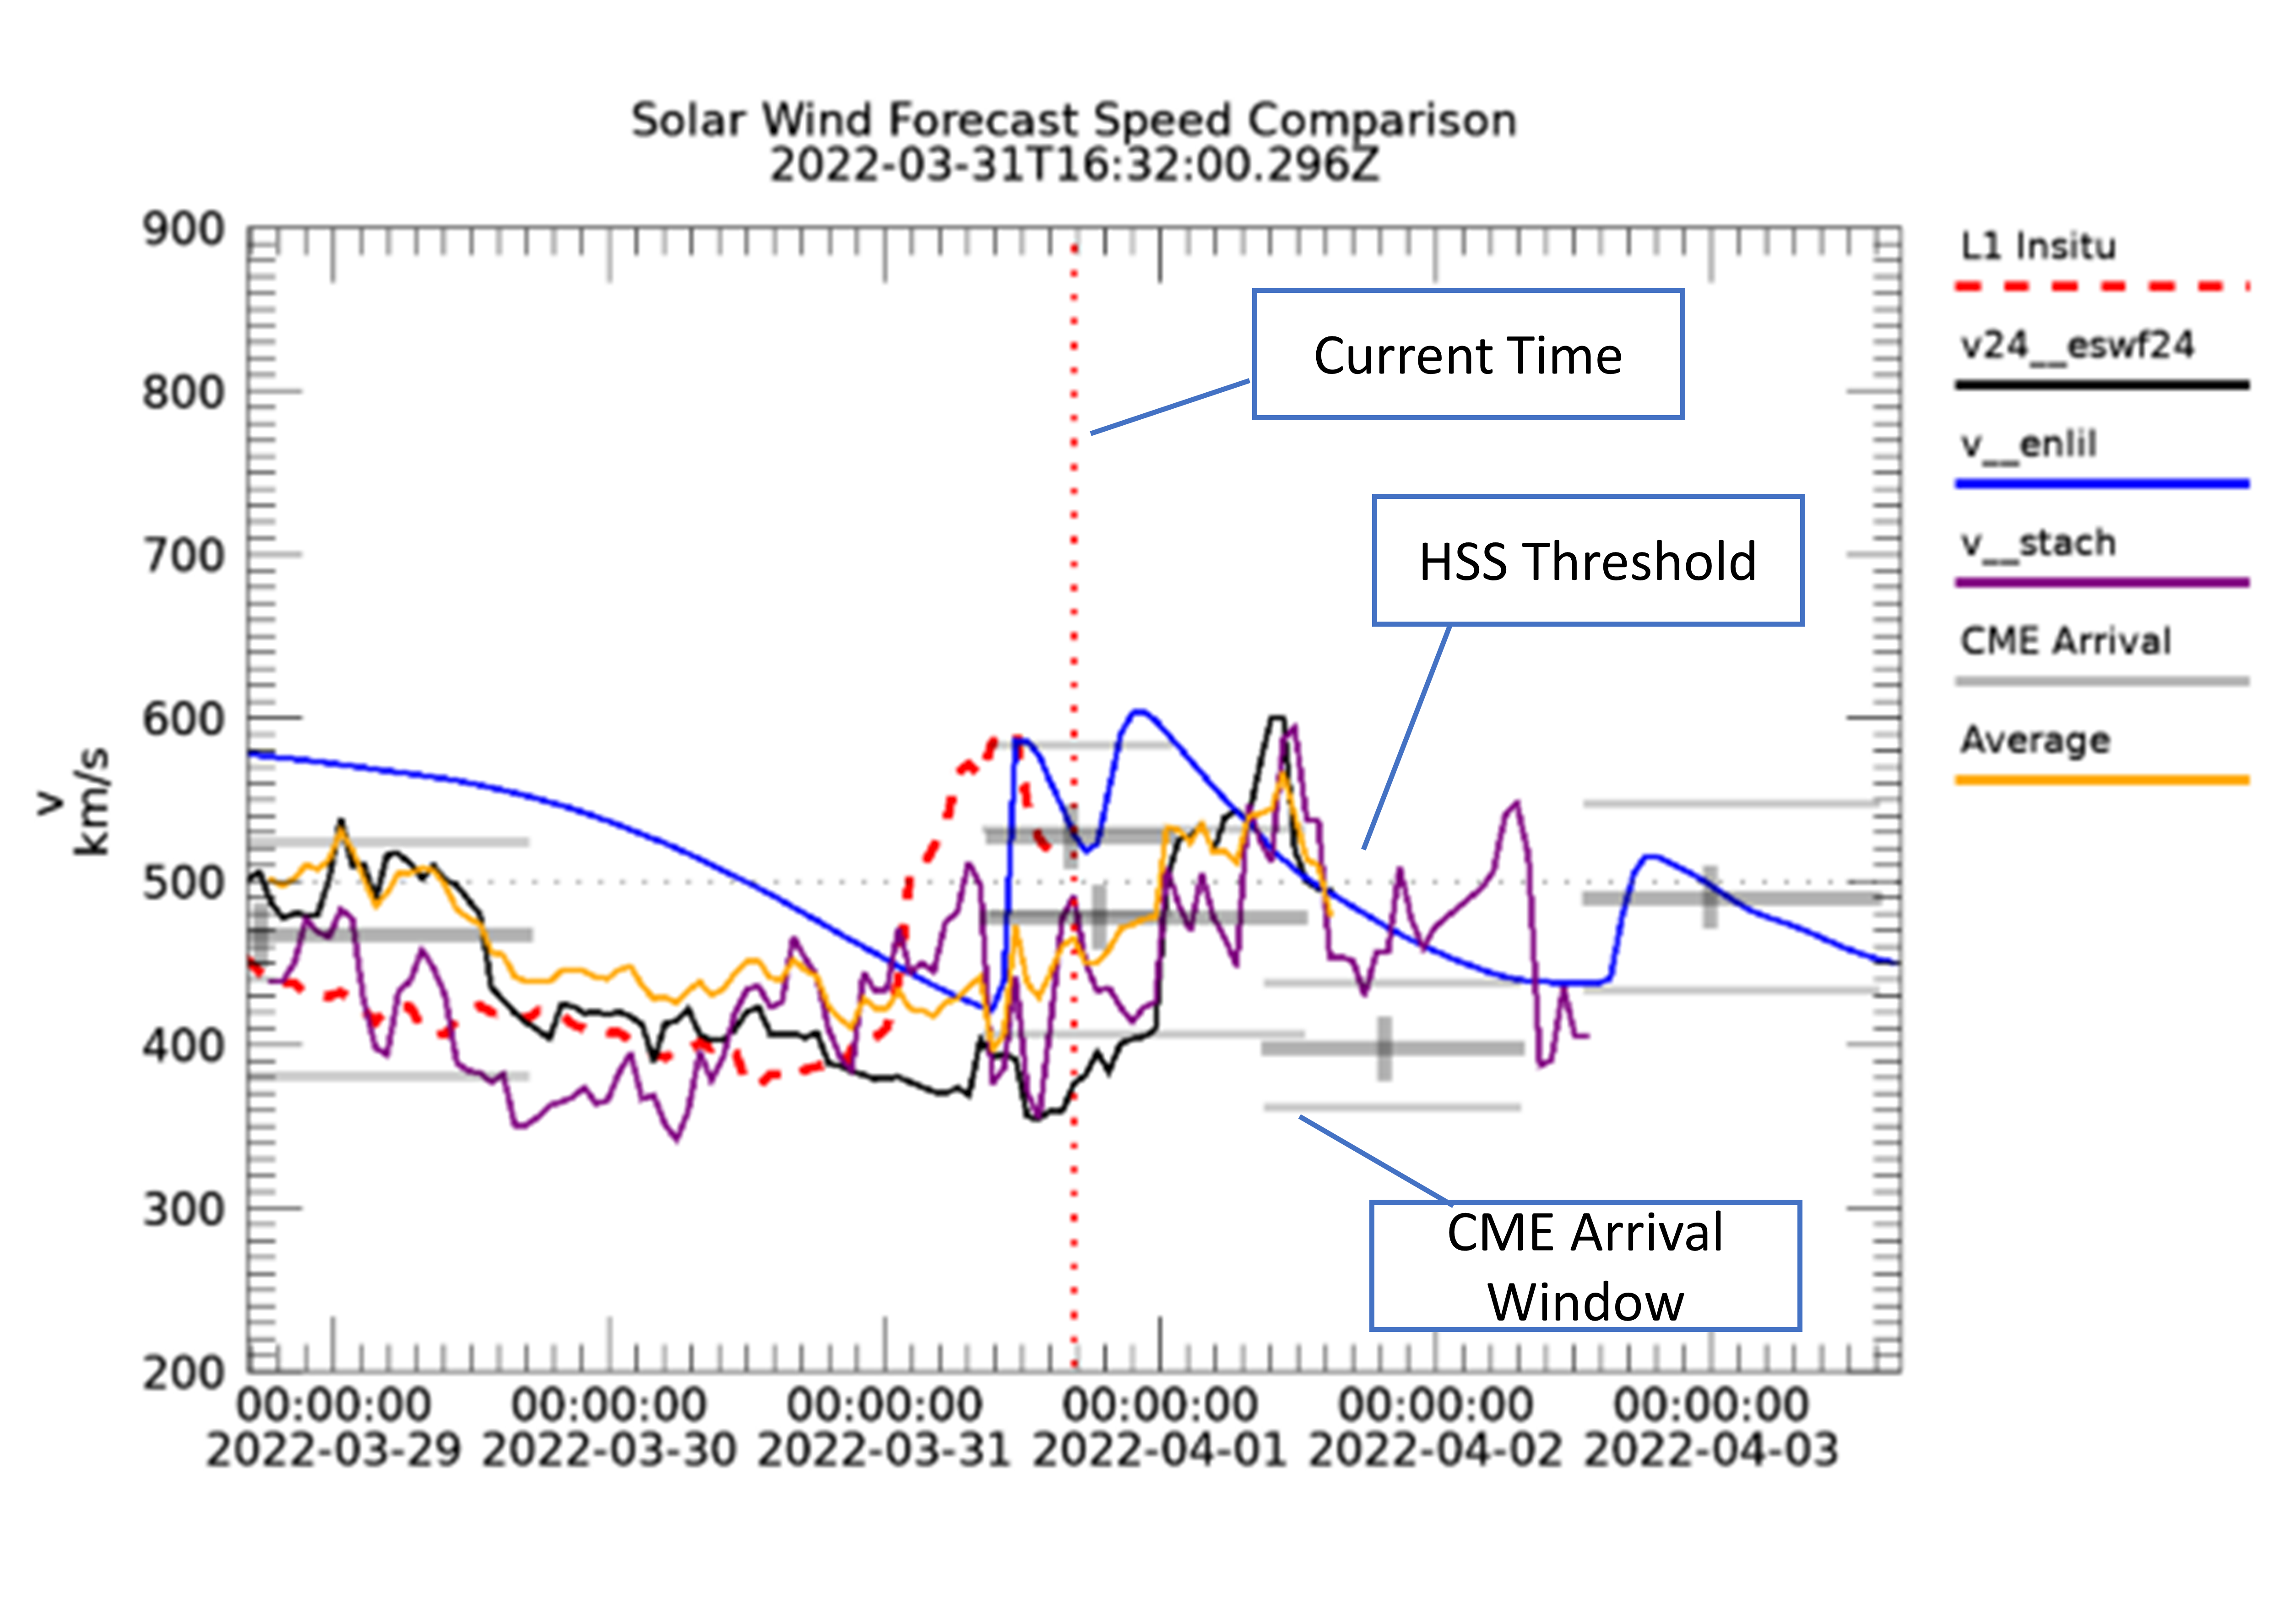
When the product is opened the default comparison plot is displayed. The presentation displays a +/-3 day window centred on the current time (T UTC). The current in-situ (L1) solar wind speed data is shown as a reference in the T-3 day to T-0 portion of the plot and can be useful for assessing the recent performance of the forecasts. Users are advised to check the individual product pages linked below for more general information about the models, their uncertainties and validation.
Initially the latest pre-generated plot is shown. The plot is updated every hour whether or not the underlying model data have changed. The plot is updated every hour whether or not the underlying model data have changed. The default presentation is also used for the dashboard tile for this product and includes three models, a physics based model (Enlil 3D MHD from UKMO), an empirical model (ESWF24 from UNIGRAZ) and a persistence based model (STEREO+CH from UNIGRAZ). The low resolution in-situ data from ACE is provided via the ESWF24 product from UNIGRAZ. In addition an average of the selected models is shown (please note this is only generated for intervals for which all model outputs are available).
A dotted vertical line marks the current time and a dotted horizontal line at 500 km/s provides a guideline for the high speed stream threshold.
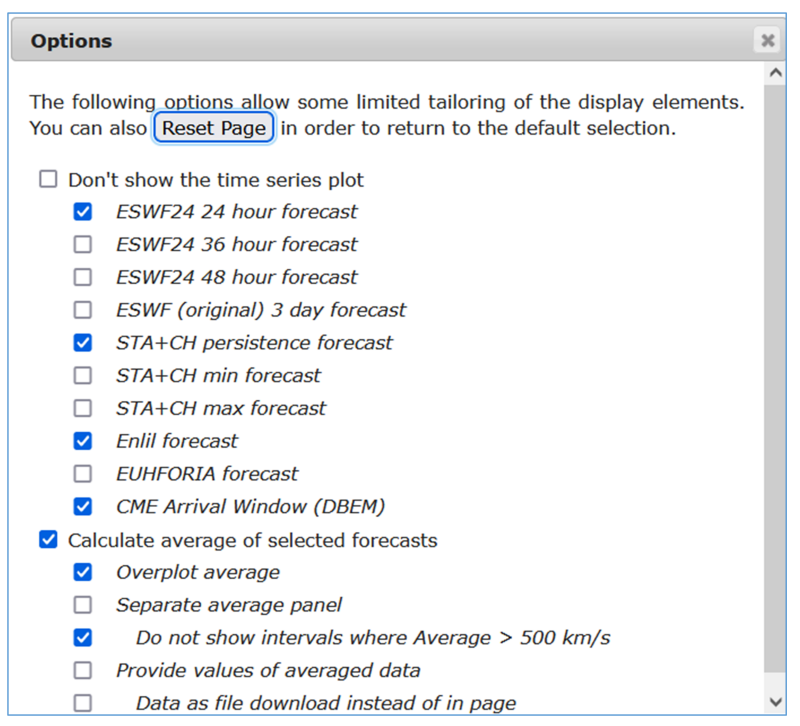
A number of options for tailoring the output of the product are provided. These are accessed via the first icon at the top of the product results. An options window will appear, any changes will not be applied until the Submit button is clicked.
The first section of options is for the selection of the models that are to be displayed (see below for more information on the models). In some cases a particular model has more than one output that can be used. The models selected will be used both for the plot and for the calculation of the average. The option to suppress the time series plot will not display the default model comparison plot and is only useful if one of the options from the second section is selected. The CME window based on DBEM is presented as three horizontal bars corresponding to the uncertainty in arrival speed and time of CME. The accuracy of the background solar wind models is degraded during a CME arrival since the CME is not accounted for in the model.
The second section of options is linked to the average of selected models. The data from all models is conformed to a common timeline using nearest neighbour selection. At each time step for which all the requested models have a value the arithmetic mean of the speed is calculated. If one or more models do not have data then an average for that data point is not provided in order to avoid artefacts due to model availability in the output. If this is an issue then de-select the model with the data gaps or with a restricted time range.
If the separate panel is displayed this will only display the averaged model output and lines corresponding to the maximum and minimum values of all selected models at each time. Unchecking the do not show intervals will provide a visual indication and list the time intervals for which the average speed exceeds a nominal high-speed stream threshold of 500 km/s.
The last two options display the digital values of the average either within the page or as a download link. The file is a comma separated ASCII file consisting of a five line header followed by data records consisting of the time stamp (ISO8601 calendar segmented format), the average speed and the minimum and maximum speed of the selected models at each time. The time resolution of the output file is typically 30 minutes and data is only forecast data (from the current time onwards),
The cogwheel icon provides a URL corresponding to the current configuration and the print icon will allow printing of the results area of the product without the additional user interface controls.
H.101z makes use of the following forecast solar wind speed models that are federated by expert groups within the H-ESC. The cadence and lead-times are indicative as these can depend on a particular model run or critical data inputs. There is no synchronisation between the time-stamps on the different models whether or not they have the same cadence. In some cases interpolated values may be provided by the model.
One key distinction about the models is whether they provide information only about the background solar wind or if they also incorporate the effects of non-persistent features such as Coronal Mass Ejections (CMEs).
| Product | EG | Title | Cadence | Forecast Lead-time | Type |
|---|---|---|---|---|---|
| H.101a | UKMO | 1 hr | 5 days | Physics - MHD (bkgd+CME) | |
| H.101b | UNIGRAZ | 1 hr | ~3 days | Empirical (bkgd) | |
| H.101e | UNIGRAZ | 1 min | ~2.5 days | Persistence (bkgd) | |
| H.101g | RAL/KUL | 1 hr | 5 days | Physics - MHD (bkgd+CME) [Demo Product] | |
| H.101h | UNIGRAZ | 1 hr | 24, 36 and 48 hrs | Empirical + Assimilation (bkgd) | |
| H.108b | UNIGRAZ | N/A | ~2 days | Physics - drag based ensemble (CME) |
This product provides a single tile that may be included in one or more of the service or domain dashboards. It contains a single plot corresponding to the default selection when this product is first opened.
Please take account of the following caveats when using this product
This web page forms part of the European Space Agency's network of space weather services and service development activities, and is supported under ESA contract number 4000134036/21/D/MRP. For further product related information or enquiries contact the helpdesk. E-mail: helpdesk.swe@esa.int All publications and presentations using data obtained from this site should acknowledge RAL Space and The ESA Space Safety Programme. For further information about space weather in the ESA Space Safety Programme see: https://www.esa.int/spaceweather Access the ESA SWE Portal here: https://swe.ssa.esa.int.